Google Releases Data Blending in Google Data Studio
Combine Different Data Sources Within a Single Chart
Data Studio is Google’s very powerful data visualisation tool which is great for bringing together data from multiple sources and presenting it in a highly visual and accessible way. With the introduction of data blending, it now allows even more flexibility by enabling you to combine multiple data sources directly in the Data Studio UI and visualising your results in a single chart.
This capability allows you to draw on your favourite data sources such as Google Ads and Google Analytics and join them together with each other or third-party data sources via a common set of dimensions. Previously it was only possible to have one data source per graph or table but now Google allows you to merge up to five different sources of data within a single graph / table.
Getting Started
Step 1
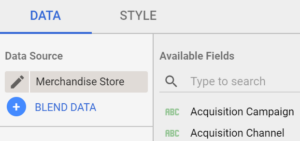
If you have Data Blending available, you’ll see an option underneath your Data Source that says “Blend Data.” when you click on any current chart.
Step 2 Select Your Data Sources
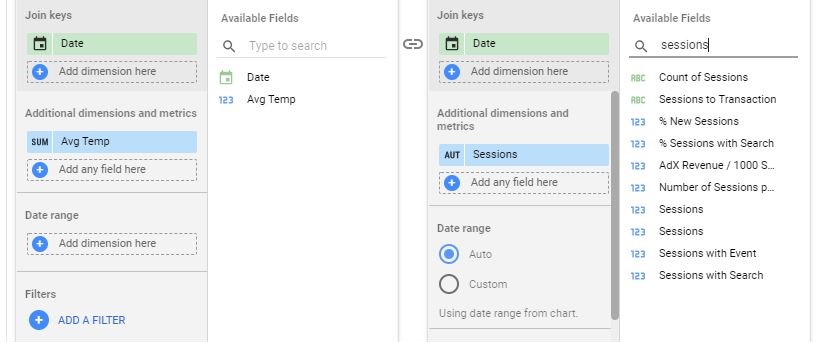
In order to blend data, you need to ensure the data sources you want to combine have a common piece of data known as ‘Join keys’, whether this be date, channel source, or id etc. These ‘Join keys’ don’t have to be named the same in both data sources but they do need to have the same data otherwise it won’t work. You can combine data using one or more join keys.
In the example below we are joining Google Analytics data and external data joined by date, in order to see visits to the website and what the average daily temperatures were on those days.
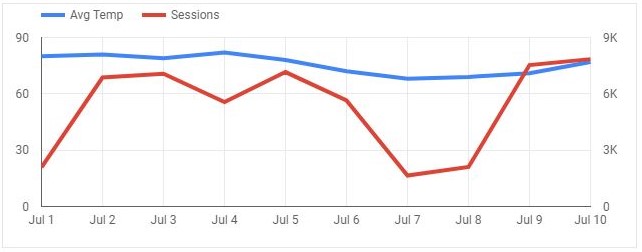
Once done, a new chart object will be created which you can then style and customise. The result might look like this:
Combine Existing Charts Together with Data Blending
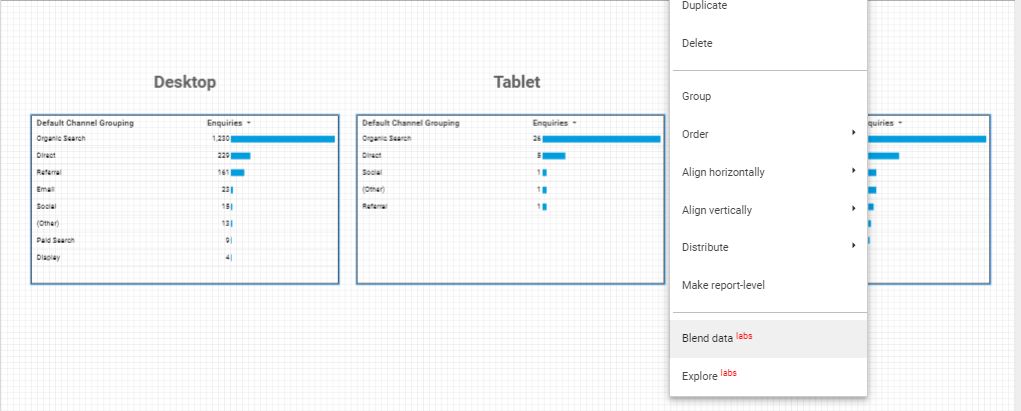
You can easily combine existing data you have on page by selecting each chart (holding ctrl) and then right clicking to get the menu with the option to Blend Data. Here we have selected three charts to combine.
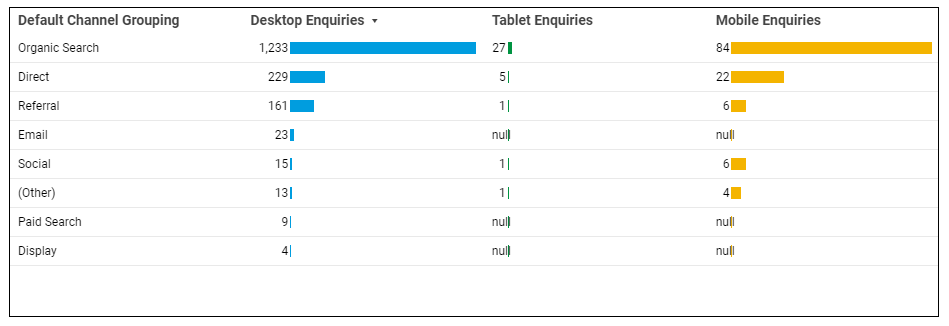
Once clicked, it will automatically create a new additional chart with the data combined. You will want to rename your column headers and set the styling but the result is a good one.
Manage Blended Data Sources
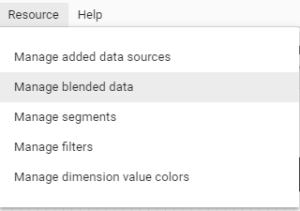
Blended data sources in a report are listed under the DATA tab of the properties panel, under Component Data Sources. You can also view and check the status of all your blended data sources by going to Resources > Manage blended data. This will allow you to edit or delete any blended sources you have created.
Other Ideas for Using Data Blend
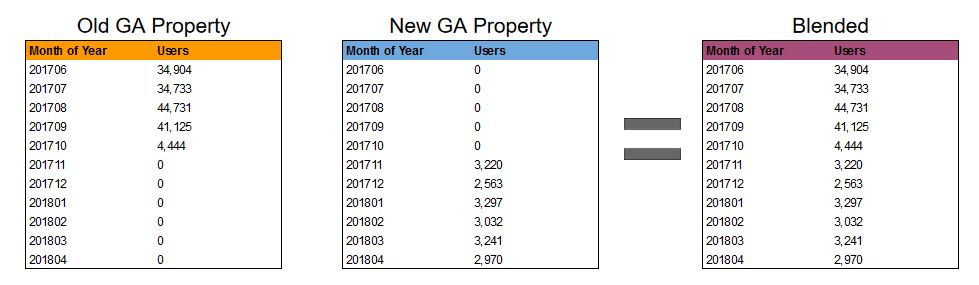
1. Fetch Data from different analytics properties – for example if you have data from an old website you want to merge with data for a new website, you could combine both properties into single report.
2. Combining GA data with an external sales data
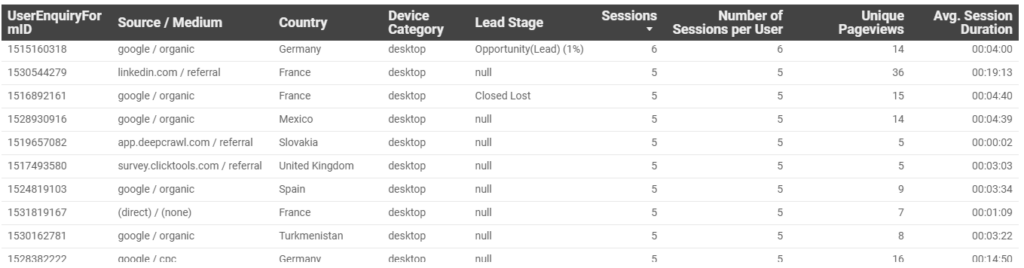
Use your sales data located in a spreadsheet or connected database and combine it with web analytics data to understand the website activity of the enquiries that are driving qualified sales and leads. In this example, data has been joined by form ID which has been made available in both Google Analytics and the CRM system.
3. Email Campaigns vs Website Performance
The potential to blend data also means you could bring in data about a specific email campaign and compare open rates and click-through rates in the same table as website performance, goals completed, and Ecommerce performance.
Summary
Data blending is a fantastic new addition to an already brilliant reporting platform. This new functionality brings it inline with other enterprise reporting tools and brings about more possibilities and potential applications. We look forward to seeing what other Data Studio features come down the pipeline from Google in the future.