How to use digital marketing insights to drive visitors to your region, destination, and venues

In August our Head of Client Strategy, Thom Shardlow and Paid Media Strategist, Matt Cocking, presented a webinar depicting how to drive visitors to your region, destinations and venues.
What is a DMO?
A DMO is a Destination Marketing Organisation, whose purpose is to promote destinations, attract visitors and develop a regional economy.
Overview
Utilising some of the top industry tools, Meltwater and Similarweb, Anicca compiled a competitor and market analysis piece for 31 DMOs at national, county and city levels.
Our market analysis will take you through four key categories. These include:
- The market as a whole
- Marketing channels and Leaders
- Audience & Demographics
- Personas
Market Analysis
This analysis uses a variety of DMOs to gain a bigger picture of exactly which channels these DMOs utilise as a group. It also allows us to highlight similarities and differences in these businesses’ marketing choices. In this analysis, there are 1.077 million unique visitors, who have generated a total of nearly 6 million sessions. We cover sites such as Visit London and Visit Manchester, which are good examples of city-related DMOs along with Visit Cornwall and Visit Dorset, which are both county-level.
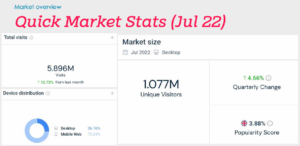
Image One: Quick Market Stats (July 2022) – Simiularweb Data
Visit Duration vs Bounce Rate
This is primarily for informational purposes for businesses for which this is relevant, but this gives us a quick snapshot of which businesses have low bounce rates and high visit duration. For example, Visit Cumbria.com has an impressively low bounce rate and high visit duration rate. This provides a good insight into:
- How well the website is built
- What the user experience is like
- Monitoring competitors’ campaign results
All this information is available from the tools that we employ.
Traffic Over the Year
As the graph below shows, traffic peaked in August 21 and then declined gradually for the rest of 2021. Traffic climbed gradually from early 2022 despite a small dip in June. This overview allows us to gain a good idea of exactly how many visitors and what the traffic share was for these top 10 sites at a given time.
The amount of traffic that we’re seeing in July 22 was more than that of July 21 (not shown) last year, therefore it’s important we monitor this for each month, as it reflects each campaign’s impact.
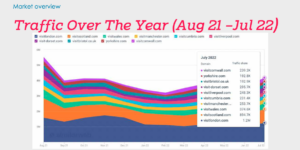
Image Two: Traffic over the Year (Similarweb Data)
Summary of Market Overview
In our analysis the top-performing DMOs for July 2022 are:
- National: VisitScotland.com
- Country: Visit-Dorset.com
- City: Visitmanchester.com
The market has a total split of 26.71% visiting via a desktop versus 73%.29 visiting on a mobile device. Traffic for the top ten DMOs, within our analysed industry, peaks at a total 5.58m in August 2021. Traffic to the same 10 DMOs in July 2022 peaked at 4.123m, therefore August 2021 was more popular.
Marketing Channels
For the marketing channels, we have combined data from 31 of the DMOs. From this, we can see the percentage split of the channels these businesses are using to generate traffic. Here are the key highlights from this:
- Organic search: 84.62%
- Direct Traffic: 11.05%
- Referral: 2.47%
- Social: 1.01%
- Paid Search: 0.36%
- Display Ads: 0.25%
Display Advertising and Paid Media
- Tools like Google Display Network and social media channels have a notable impact on direct traffic. These channels are great for running awareness campaigns for the business or their location.
- VisitScotland.com has a high display advertising portion of its traffic. In our analysis, VisitScotland had 0.6% of their traffic coming via display ads, a good example of a business using display advertising to attract traffic.
- Finally, ExperienceOxford.org has a high amount of traffic generated by paid search, showing that this can be a viable channel and represents an opportunity for others to follow suit.
Using these examples, we can start to cherry-pick information from those strategies, examine what those businesses are doing with their channels and start to apply that to other businesses as well. It’s important to use this information as effectively as possible.
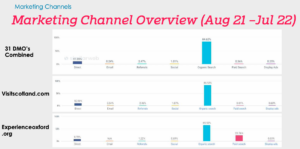
Image Three: Marketing Channels (Similarweb Data)
The image above demonstrates marketing channels that are driving the traffic. Here are the key takeaways from this:
- Google organic search at the top with 76% of the traffic.
- Image Search is third which is not surprising based on some of the locations that are in this analysis.
- Referral channels are being used, which has a knock-on effect on generating traffic. This includes the impact on your domain rating, it can help your business grow directly and organically as well.
Summary of Marketing Channels
- Currently, the key marketing channel for DMOs is organic search.
- A large increase in direct traffic often demonstrates the use of display-style advertising across both Google and social media channels. There’s also a strong likelihood of other digital and offline media being used here too.
- Referral traffic is the 3rd highest contributor of traffic to the sites in our analysis. This also has a strong knock-on effect for organic traffic due to the impact that link building can have on domain ratings.
- Paid search still appears to be an underutilised platform for several DMOs.
Audience and Demographics
To gain a full understanding of what our audience looks like and how we can target most effectively, we use data from Similarweb and Meltwater. Starting with Similarweb, the image below shows data from August 2021 onwards:
The key statistics include:
- United Kingdom provided 2.7% of the traffic to these DMO sites. Therefore, a large group of people from the United Kingdom are actively searching for destinations to visit.
- July 2022 showed a 20% drop in traffic share coming from the UK.
- All other countries have almost doubled in terms of the number of visits and the amount of traffic coming from those countries.
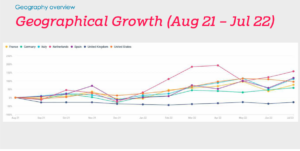
Image Four: Geography Growth (Similarweb Data)
Demographics are key to learning about the audiences that are visiting these DMO sites. From our analysis, we can see that:
The gender distribution of site visits is:
- 43% Male
- 57% Female
The age distribution is highlighted in the image below:
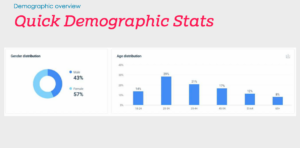
Image Five: Quick Demographic Statistics (Similarweb Data)
Summary
- The YoY comparison shows us that geographically, DMOs are receiving hugely increased traffic from outside the UK in 2022. Specifically, we can see countries such as the US, Germany, France, and Italy’s traffic to these DMO sites has doubled.
- The geographical growth information helps highlight which countries are driving more or less traffic through specific months of the year.
- Demographically, city-level DMOs tend to obtain traffic from a younger part of the population.
Persona Overview
Combined Persona
The Meltwater software allows us to include data relating to social media accounts, therefore we can look at who is following which DMO. From Meltwater data we can gather the 31 DMOs’ social media usernames. From this, we can gather audience data, as the image below shows.
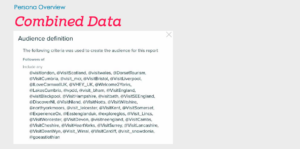
Image Six: Combined Data (Meltwater Data)
From Meltwater data, we can analyse the interests. The interests ascertained can become very granular, from the combined persona, specific examples of geographical interests and media habits can be tracked. Two examples of this include:
- A quarter of a million followers combined (13.75%) of them have a passion for the North-East.
- We can track distinctive bio keywords that are of interest for example, football, tv programmes and films. Therefore, we can learn more about the audience that engages with these DMOs.
Combined Social Economics
The combined social economics allows us to learn more about social behaviours and the social science behind this. From Meltwater, we were able to understand this about the DMOs audience. Here are the key findings from this:
- DMO followers are two and a half times more likely to be university educated.
- Also, these followers are seven times more likely to be in a managerial position.
- Finally, they are nearly ten times more likely to be married than the rest of the UK.
A DMO’s message and tone of voice should have the aim of building a relationship with the audience, in order to promote the DMO’s destination as something they would visit.
Persona – Visit Leicester
This persona is an example of someone who has a strong interest in the DMO Visit Leicester. This persona data was taken from Meltwater data, some key insights include:
- Leicester City Football Club fan: This persona demonstrates their keen interest in sports, therefore buzzwords that appear linked to the Leicester sports team.
- The Arts and Theatre: This persona includes interests in the Attenborough Arts Centre and Art Councils in the East Midlands.
This information feeds and influences how a DMO’s imagery and campaigns should look in order to attract the right persona and their interests.
Interests
Meltwater data also allows interests to be monitored, the image below shows the interests of the DMO follower, specifically focusing on food and drink. We can observe quite granular metrics about the popularity of this interest, which can provide the DMOs with foundations for their marketing campaigns.
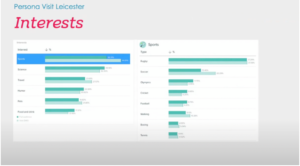 Image Seven: Interests (Meltwater Data)
Next steps?
- How can this be useful for you?
- Would you like a rundown of your own data?
- Do you need to encourage footfall for annual events?
- Is there a 2023 initiative you need help with?
- We are a full-service agency from insight through to creative
Watch Thom and Matt’s webinar to find out even more!