Digital Marketing Insights for the Construction & Building Supplies Industries

In August, Head of Client Strategy and Creative, Thom Shardlow and Paid Ads Strategist, Matt Cocking presented a special industry webinar discussing digital marketing insights to understand some of the trends within the construction and building supplies industries.
Methodology
Utilising some of the top industry tools, Anicca have put together a competitor/market analysis piece for 30 of the biggest construction businesses in the UK.
On a national level, Anicca have assessed:
- The market as a whole
- Marketing channels and leaders
- Audience and Demographics
- Personas
- Creative Overview (B2B & B2C)
Although the biggest construction companies may not directly apply to your business, the methodology remains relevant.
Market Overview (Similarweb Data)
The image below shows the top-performing companies with currently active projects. From this list, we can draw a wide range of data to analyse. We can learn about which marketing channels they use, how many users are in the industry, and traffic sizes.
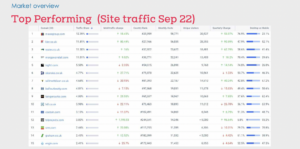
Image One: Top Performing (Site Traffic Sept 22) – Similarweb Data
Using Similarweb Data, we can analyse the top-performing groups by their site traffic. As the image below demonstrates the groups’ traffic is evenly spread. The three top-performing organisations are:
| Domain | Traffic Share | MoM Traffic change | Country Rank
| Monthly Visits | Unique Visitors | Quarterly Change | Desktop vs Mobile |
| Macegroup.com | 12.39% | 18/45% | #29,959 | 58,771 | 20,527 | 53.97% | Desktop: 76.9% Mobile: 23.1% |
| Kier.co.uk | 11.81% | 80.44% | #27,166 | 56,035 | 28,355 | 90.89% | Desktop: 47.9% Mobile: 52.1% |
| Wates.co.uk
| 11.30% | 16% | #37,922 | 53,625 | 18,481 | 62.79% | Desktop: 58.6 Mobile: 41.4% |
However, the image demonstrates the significant growth that some of these groups are experiencing thanks to the utilisation of the different marketing channels.
Market Statistics
Here are a few quick market stats, to show a snapshot of site visits, device distribution and market size from August 2021 to September 2022.
- Total Visits: 5.336 million
Device Distribution:
- Desktop – 49.93%
- Mobile web – 50.07%
Market Size:
- 82,553 Unique visitors
- 23.99% Quarterly Change
- 0.3% Popularity Score
Traffic over the year (Oct 21 – Sept 22)
Over the past year, the image below shows the websites receiving the most traffic. From this graph, you can gain a great insight into the best performers for each month as well as see developing trends.
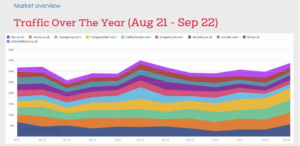
Image Two: Traffic over the year – Similarweb Data
Summary – Market Overview
- The market overview report helps us determine who the best-performing businesses are for our selected industry.
- The data helps us understand which businesses are worth comparing to and which are “Up and coming”.
- We can analyse the traffic trends throughout the year, helping us understand when it’s most and least important to be utilising marketing spend.
Marketing Channels
From the 30 construction groups, we can see which marketing channels are the most popular from October 2021 to September 2022.
- Organic Search: 45%
- Direct: 35.96%
- Referrals: 10.48%
- Socials: 4.42%
- Email: 2.59%
- Display Ads: 0.79%
- Paid Search: 0.68
Marketing sources
The marketing sources data allows us to view which websites are building the organic searches. The top five traffic sources are:
- Google Search
- Direct
- Microsoftonline.co.uk
- Sharepoint.com
There are some referral search sources which means you have shared documents or posts from this website, or you are using display advert marketing and it’s re-directing.
Direct Traffic leaders (September 2022)
As the image below demonstrates, the traffic leaders reflect the marketing activity, therefore the construction group with the most direct traffic is Macegroup.com. This is due to their strong brand identity and utilisation of marketing channels.
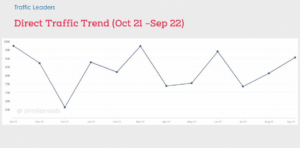
Image Three: Direct Traffic Leaders (Similarweb Data)
Paid Search Traffic Leaders
There is one group with significant paid traffic use; hill.co.uk. However, it is concerning that other construction groups are not utilising this to their full advantage.
Summary – Marketing Channels
- The marketing channels report gives us a very quick snapshot of exactly which digital marketing channels are most important for businesses in our comparison. This snapshot can include:
- Organic traffic trends and leaders
- Direct traffic trends
- Referral traffic trends and leaders
- Social traffic trends and leaders
- We can also see the marketing sources that provide this traffic, giving us a strong indication of which digital activities we should be undertaking.
- We’re able to spot trends in traffic for each individual digital channel, giving us a much clearer picture of when we utilise those channels most effectively.
- We can see exactly which businesses’ strategies to review first from the traffic leaders reports, based on who is performing best on each channel.
Audience Overview
The audience overview provides us with information regarding the demographics. Starting with geography, the image below shows visits from across the globe. The majority of the 31 construction groups operate globally, however, as the table demonstrates, the United Kingdom is first with traffic share of 47.38% and just over 250,000 visits. In second place is France with 11.73% of traffic share and 62,343 visits. Finally in third place is USA, with 4.95% of traffic share and 26,291 visits. These statistics were for September 2021.
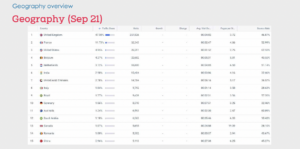
Image four: Geography Sept 2021 (Simularweb Data)
Quick Demographic Statistics
This is a simple breakdown of the demographic statistics, providing gender and age distribution of the construction groups’ audience.
Gender
- Male: 58%
- Female: 42%
Age Distribution:
- 18-24-year-olds: 14%
- 25-34-year-olds: 29%
- 35-44-year-olds: 24%
- 45-54-year-olds: 17%
- 55-64 -year-olds: 10%
- 65+: 6%
The demographic breakdown of the top 15 construction groups, was collected through Similarweb. In first place is Kier Group, with the highest traffic share of 10.07%. However, across all the construction groups, 25-34 years are the most popular demographic age, which Mace Group having the highest percentage at 32.4%.
Summary
- The audience overview report allows us to determine if our marketing should be centred around a particular country, or if efforts need to be spread across multiple countries for the best performance.
- We can discover which countries are providing an increasing or declining rate of traffic in the last year, providing guidance as to where we may be able to expand our marketing efforts.
- We can gain a quick overview of the demographics that make up our traffic, such as age and gender.
- We can also see a breakdown of each business’ current demographic split, giving us the opportunity to adjust creative assets to suit the needs of our most important demographical groups.
Persona Overview
For the combined data, we are using the followers from the previously mentioned 30 construction groups. The personas of the construction industry are broken down into the following list:
- Civil engineers
- Construction Innovators
- Architecture
- Renewable energy
- Social Housing
- Equipment Hire
- Electrical safety
- Property sales
Therefore, when the construction industries are planning their marketing campaigns, it is essential to have these campaigns aimed at at least one of these personas. The image below demonstrates a comparison between the construction audience against the UK general audience. The six categories of this are:
- Gender
- Country
- City
- Term
- Age Range
- Name
From this information, the construction groups can evaluate their marketing campaigns and work with this data to ensure they are being aimed correctly.
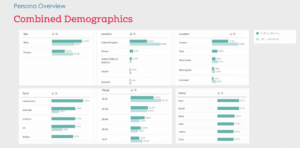
Image Five: Combined Demographics (Meltwater Data)
When applied to combined social economics, the construction audience can be compared with the UK general audience. The key points from this are:
- The UK general audience is twice as likely to be university-educated than someone in the construction industry. Therefore, the tone of voice of marketing campaigns can be adjusted accordingly.
- Also, the UK general population is ten times more likely to be married than someone in the construction industry. Therefore, imagery, tone of voice and colours need to reflect this.
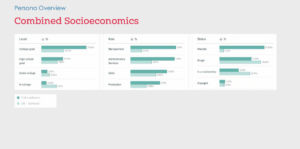
Image Six: Combined Socioeconomics (Meltwater Data)
Channel relevance combined
The channel relevance depicts the most used marketing channels, with LinkedIn being the leading network; important to note for specific network-led campaigns. Also, this table demonstrates the popularity of blog sites, specifically Medium this is a blog-led site, which is four times most likely to be used.
What are the next steps?
- Would you like to run your own data?
- Do you need to entice footfall for annual events? Eg. Christmas
- Is there a 2023 initiative you need help with?
Watch Matt and Thom’s webinar to find out more!