Evaluating Which of your Google Ads Adverts Performs Best
Anyone who is familiar with marketing will know the importance of choosing the right message when advertising, considering what message will best entice the reader to take the actions that you desire them to. As people will react differently to different messages, it is important to work out which message works best for your services. This can only be achieved through testing different adverts and evaluating the resulting performance.
Unlike traditional marketing methods, search advertising through platforms like Google Ads makes it easy to track top-line performance statistics that your adverts achieve (e.g. how many times your ad is seen, how many sales come as result of your advert). But if like many advertisers you are actively testing more than one ad message, following Google’s recommended guidelines of testing at least three adverts per ad group, ideally you would want to know which of your adverts is performing best, in relation to your business goals. Here are some methods worth considering when evaluating your Google Ads advert’s performances:
Basic Methods of Evaluating Advert Performance
1. Look at basic Google Ads statistics
The top-line statistics data that is shown in Google Ads can be useful for assessing your advert performance. Has your overall performance changed since altering the advert you are using? If you are using multiple adverts within one campaign, you can sort your adverts within the ‘Ads’ tab by any of the columns listed to gain insights, such as which has had the best click-through rate (CTR) or has gained the most conversions.
This however is not a viable method for evaluating adverts across your account as each of the Google Ads metrics only gives insight into a portion of the customer journey. You can’t possibly learn anything from one user interaction with your advert, so we will need to be able to combine the data from the same advert being used across multiple ad groups or campaigns.
2. Predefined reports
If you choose to only use one advert at a time within an ad group or campaign, you can use the Predefined reports within the Reporting tab to view all the performance statistics of an ad group or campaign over whatever date/time period you deem relevant. By viewing the ‘Time’ option, you can set the data to be shown in the periods of days, weeks, months and more. This allows you to see all your key performance metrics at once in a row, making it easier to identify trends in performance and better understand the customer journey by seeing how users interact at different stages e.g. how many users are clicking our adverts, how many users are taking an action once on the website.
If you are actively testing two or more adverts, this method will not be viable as the data for your different adverts will be collated and displayed as a combined performance for the ad group/campaign, which does not give insight on which of your adverts is working best in-line with your goals
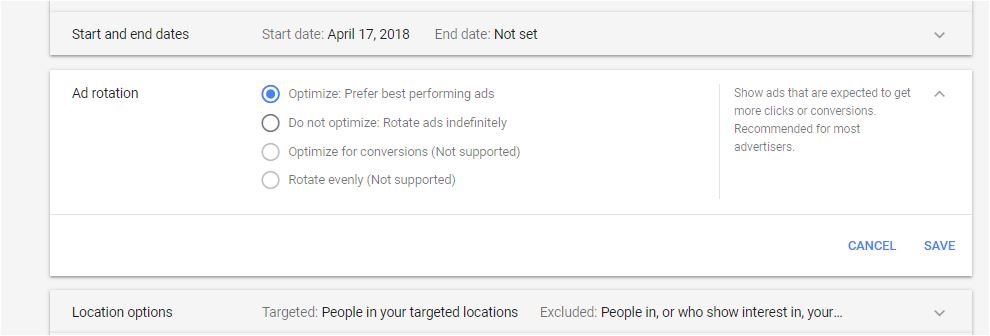
3. Set Ad delivery to ‘Optimize’
You can allow Google’s algorithms to weigh in on which of your adverts performs best by setting your Ad delivery setting within your campaign to ‘Optimize’. Google will then actively choose to show your ad copy it believes will perform the best. Once this setting has been active for a short while we can go back to the campaign where it is applied and sort adverts by ‘% Served’ at campaign or ad group level. This percentage will show us which of our adverts Google is choosing the most and therefore believes is the best.
This is not an outright method of knowing which of your adverts performs best as the methods through which Google assesses an advert to be the best are shrouded in mystery. Even if you are to select the ad delivery strategy of Optimize, which actually gives insight into what metric it is targeting as a good performance, gaining clicks or conversions may not be the key goal for your advertising.
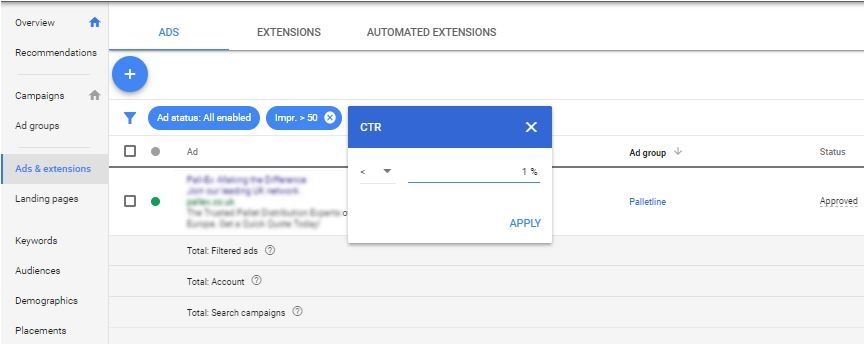
4. Filter adverts by poor performing elements
A quick method of identifying poor performing adverts, rather than top performing ads, is to filter your adverts by performance traits relevant to your goals. For example, you may filter your campaigns adverts by any that have spent 2x your target cost per lead/sale, or any that have less than a 1% CTR.
Benchmarks such as these can be very useful for completing quick optimisations and keeping your account in good shape. However, if you identify poor performing adverts it is best practice to check other elements from the same ad group (e.g. keyword, search terms, alternate adverts) to work out the real cause of the issue. This process of filtering can also be used for optimising your keywords.
5. Experiments
Google Ads key feature for testing the performance of adverts is through Experiments. These allow you to duplicate your campaign and edit an element of your adverts, usually text or URL, then you can split the traffic between the two campaign variations to test the performance of both. This allows you to test two different adverts that have one isolated element that is different, giving you true insight into which advert works better in line with your business targets.
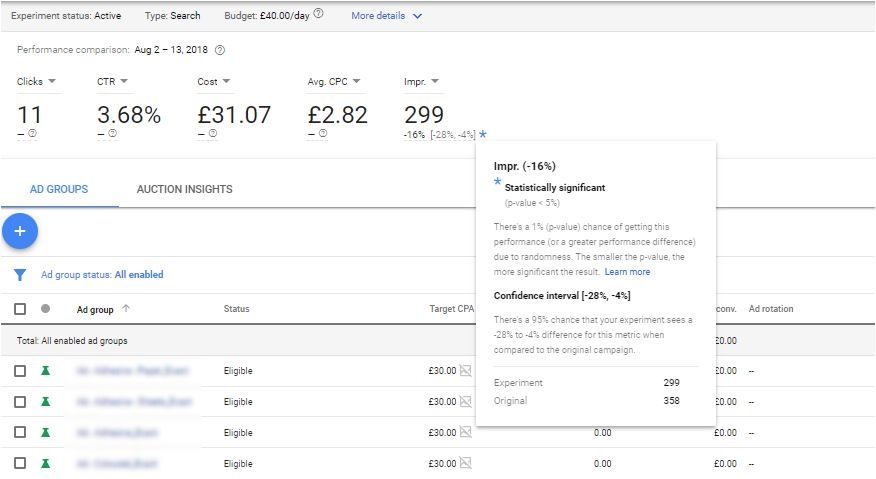
To gain insights such as this, the experiments must gain enough data for you to clearly be able to identify which version out of the experiment or the original performed the best and was not just a small sample of users, which will not be representative of the market as a whole.
Testing Multiple Adverts at Once
By only editing one element of our advert, we are isolating a single variable to test, telling us that any differences in performance to the original will be related to this isolated element. So as a best practice for testing adverts it makes sense to only test one element at a time, whether this be URL or ad text. As advertisers can often use two or more different adverts at one time, testing multiple variations of one element, we need a method of evaluating the performance of multiple adverts from across our account, side by side. To work out which ad performs best in line with our business goals we can create a custom label for each of your adverts.
Custom Labels
First, we want to create and apply a custom label for each of our adverts used. To do this we need to create a unique label for each individual advert.
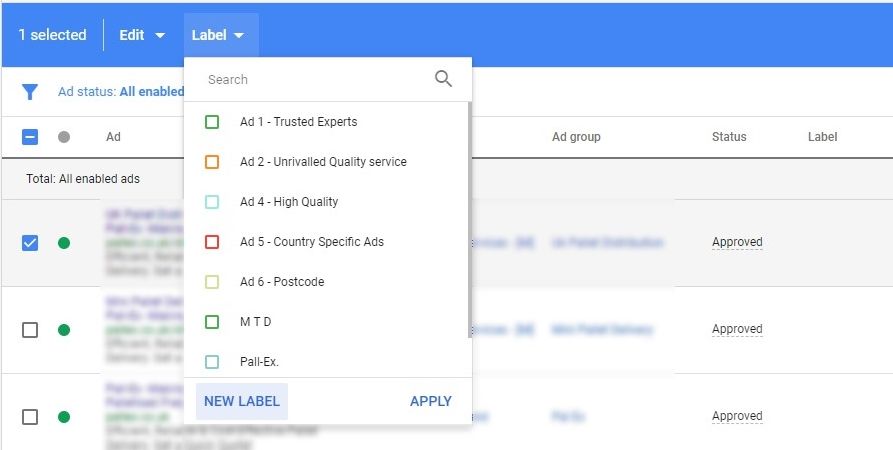
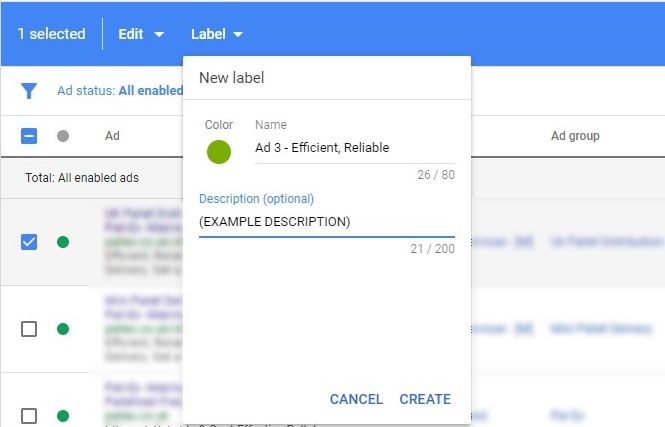
You may want to create your own labelling convention to make each of your labels easily identifiable. I usually give each advert a unique number relevant to the number of variations I have tested and a short snippet of the contents of the adverts. You can also add a description to your label if you want to leave detailed notes regarding the advert it relates to.
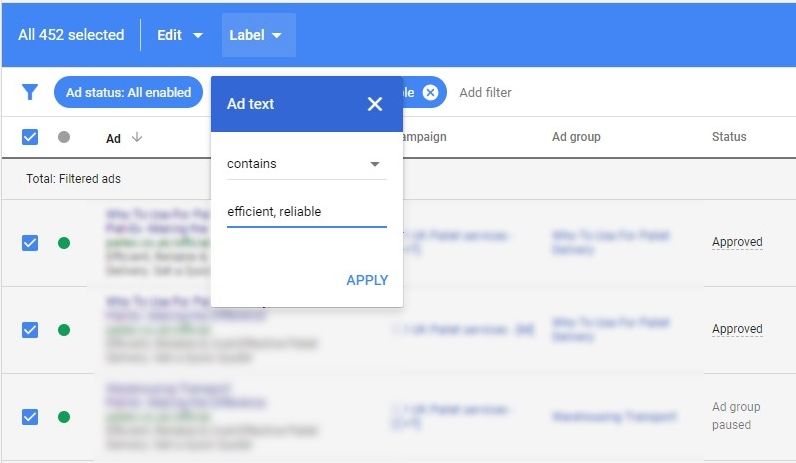
Once you have created your label you will want to apply it to all duplicate adverts that are used across the account. This can be done by filtering all adverts in your account by an element that matches only the advert you want to label. Below I have used the Ad text ‘efficient, reliable’ as a filter which I know is only featured in one of my ad copies, and then applied the label to All selected.
Once we have created and applied a unique label to all of our adverts we are testing, we can use the Predefined reports section to segment our account performance by Labels at Ad level.
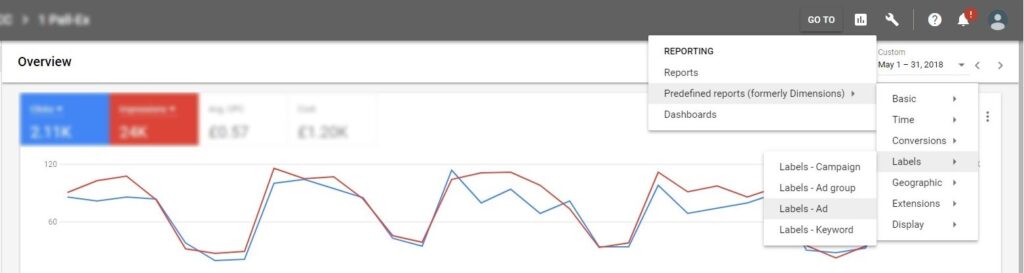
This report should now appear as in the image below, with all your advert labels displayed with all the data for each advert added together for the date range you choose. From this table we can now see all our key performance metrics alongside one another. This allows us to better understand how each advert version is performing across the whole customer journey, from when the user first sees your adverts through to completing your conversion goals, with a range of statistics provided side to side for assessment. The data columns shown can also be edited to bring in new data relevant to your goals.
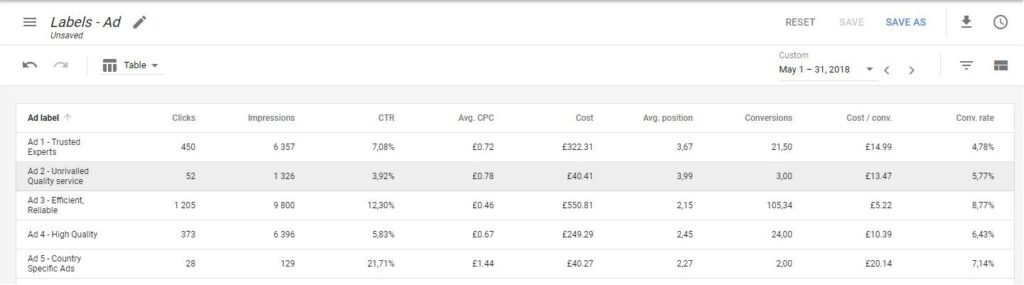
In this example I have used multiple adverts that use the same URL but use different advert text. As you manipulate the date range when viewing your ad labels, you can label existing or past adverts and see how they performed when active as all your past data is saved within Google Ads. You can use up to 200 labels in one account and they can also be applied at campaign, ad group or keyword level so the possibilities of segmenting performance using labels go far beyond just working out which of your adverts performs best.
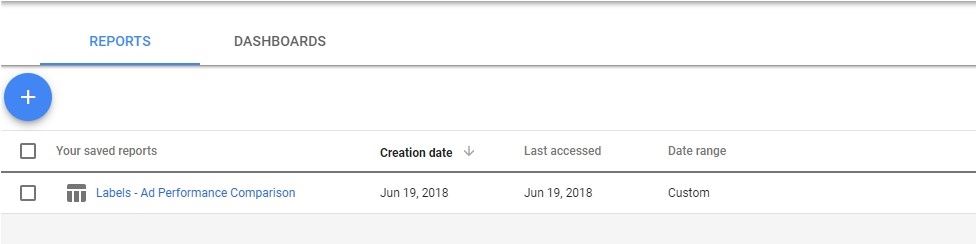
Once you have set your columns to the metrics relevant to your goals, you can save this custom report to the ‘Reports’ section for later use:
To find out more about the methods discussed in this blog or to just get some honest advice about PPC advertising please contact us at Anicca Digital.