Web Analytics News Roundup February 2023

Google make updates to GA4, but may be losing their stranglehold on the analytics market. Many invest in big-data and analytics, for future integrations.
During February 2023, these are some of the highlights so far:
- Big Data Analytics in Retail Growth Driven by Increased Spending on Big Data Analytics Tools
- Uptake to Use Daimler Data for Fleet Maintenance Analytics
- Google Improves the Ability to Manage Large Data Sets within Analytics
- Other Google Analytics 4 Updates
- Optimizely & Google Partner on GA4 as GA3 Sunsets
- Matomo named Traffic Analysis Tool of the Year (Google’s Analytics market-share drops)
Read on for our take on the analytics market in February.
Big Data Analytics in Retail Growth Driven by Increased Spending on Big Data Analytics Tools
Posted February 20th on Digital Journal
According to A2Z Market Research, posting on Digital Journal:
“The major drivers for market growth are an increase in spending on big data analytics tools, an increase in the need to deliver personalized customer experiences to increase sales, an increase in the growth of the e-commerce industry, an increasing demand for predictive analytics in retail and integration of new technologies such as IoT, AI and machine learning in big data analytics in retail.
Retailers can increase their revenue by improving the performance of their online stores using big data analytics in retail software. Retailers can optimize product landing pages using website analytics, clickstream data, and heatmap studies to ensure higher engagement and conversion rates.”
Due to recent economic turmoil, marketers need to reach customers much more efficiently than they did before. This increased competition, combined with decreasing customer spend – is driving the growth of large analytics platforms, tools and technologies. It has created an environment where and increasingly personalised customer experience is needed, in order to ascertain a conversion.
AI in particular, has a large focus on big data. AI fails to achieve much, without sufficient data models to draw information from. Even Open AI’s impressive ChatGPT would be relatively useless, without large banks of data. At a time where customers and consumers are reigning in their spending, there’s an increasing need for efficient marketing strategies (which may revolve around design, UX, Conversion Rate Optimisation, SEO, paid advertising, content) which deliver more personalised advertising engagements. Without this increase in personalisation and ad-serving efficiency, many companies will fail to reach a converting target audience.
It’s unsurprising that big-data analytics is witnessing such growth. Before marketers can tailor, streamline and personalise their engagements – there has to be sufficient data first, to create those optimisation opportunities. As technology advances to do more of the heavy lifting by itself (AI), data input is required more than ever before.
Main takeaway: Those who don’t keep their data and analytics implementation top-tier, are at risk of becoming irrelevant. For now, most powerful AIs (like ChatGPT) are confined to their own data models and select external data sources. Once these AIs can fully integrate with dedicated analytics platforms, their capacity to advise will be enhanced. But without sufficient input data, your organisation will be poorly placed to take advantage of such technological advancements. Don’t get left behind, flesh out your analytics tracking today.
Uptake to Use Daimler Data for Fleet Maintenance Analytics
Posted February 20th on Constructionequipment.com
An interesting post from Rob Sutton on Construction Equipment. To make sense of this, you first have to understand who Uptake are. For those not in the know, Uptake are data scientists, working on AI and related technologies, within the industrial sector (possibly beyond). If you visit their domain, you’ll simply be redirected to a login page. Clearly, they aren’t giving much away. This is often the case with emerging B2B technology companies, particularly when they are working on something very lucrative which also has the possibility to scale.
In his post, Rob writes:
“Uptake will use data-as-a-service technology from Daimler Truck North America (DTNA) to power its Uptake Fleet predictive maintenance and work order analytics technology.
The agreement between the two—and upon customer consent—will facilitate streaming of data. Uptake will administer the technology to help fleets optimize vehicle lifecycles and reduce repair costs using predictive vehicle maintenance. By analyzing information from subsystem sensors and work orders, Uptake can predict vehicle problems well in advance of a fault code and recommend corrective actions before they lead to costly repairs, delays, or roadside breakdowns, according to the company.”
So, why is this interesting to marketers – or those engaging with marketers? Well, Uptake produces a predictive fleet maintenance technology. Assumedly, this technology helps those operating large truck / van fleets, to better gauge when maintenance is needed, and thus keep more trucks on the road at all times (more efficient, more profit).
The interesting thing here is that Uptake have paired with Daimler, the group behind Mercedes-Benz branded vehicles. You will have noticed that in addition to luxurious saloons and sports cars, Mercedes also produce a wide range of haulage vehicles.
So, how could Daimler’s data be useful to Uptake? Straight from Upkeep’s own newsroom:
“Through this DaaS agreement and upon customer consent, DTNA will facilitate streaming of the necessary data to power Uptake Fleet. Uptake will administer the technology to help fleets optimize vehicle lifecycles and reduce repair costs using predictive vehicle maintenance. By analyzing information from subsystem sensors and work orders, Uptake can predict vehicle problems well in advance of a fault code and recommend corrective actions before they lead to costly repairs, delays or roadside breakdowns.”
This shows yet another analytics platform, ingesting large quantities of data in order to bolster efficiencies and profit (during hard times). The point here is that, yes those operating marketable websites need to ensure their analytics tracking is on-point. But the need for greater data, has not escaped those operating in other sectors.
Main takeaway: Even organisations outside of web and digital, are working on further analytics integrations. Even in the construction industry, we see analytics and AI companies, looking to bolster their data ingestion. If this is what is required for construction and transit companies, imagine how much more big-data matters for web.
Google Improves the Ability to Manage Large Data Sets within Analytics
Posted February 16th on Search Engine Journal
Another interesting post from Mat G. Southern of Search Engine Journal. We have connected with his posts previously. Matt writes:
“To improve the reporting experience, Google Analytics has introduced several new features.
These updates allow users to identify and address data quality issues, create more precise and granular reports, and adjust sampling controls for faster, more exact insights.”
The main change referenced by Matt is that the data quality icon now appears at the card-level (more granular), rather than at the overall report level. This will be great for marketers, in terms of splitting out sampled / non-sampled reporting elements:
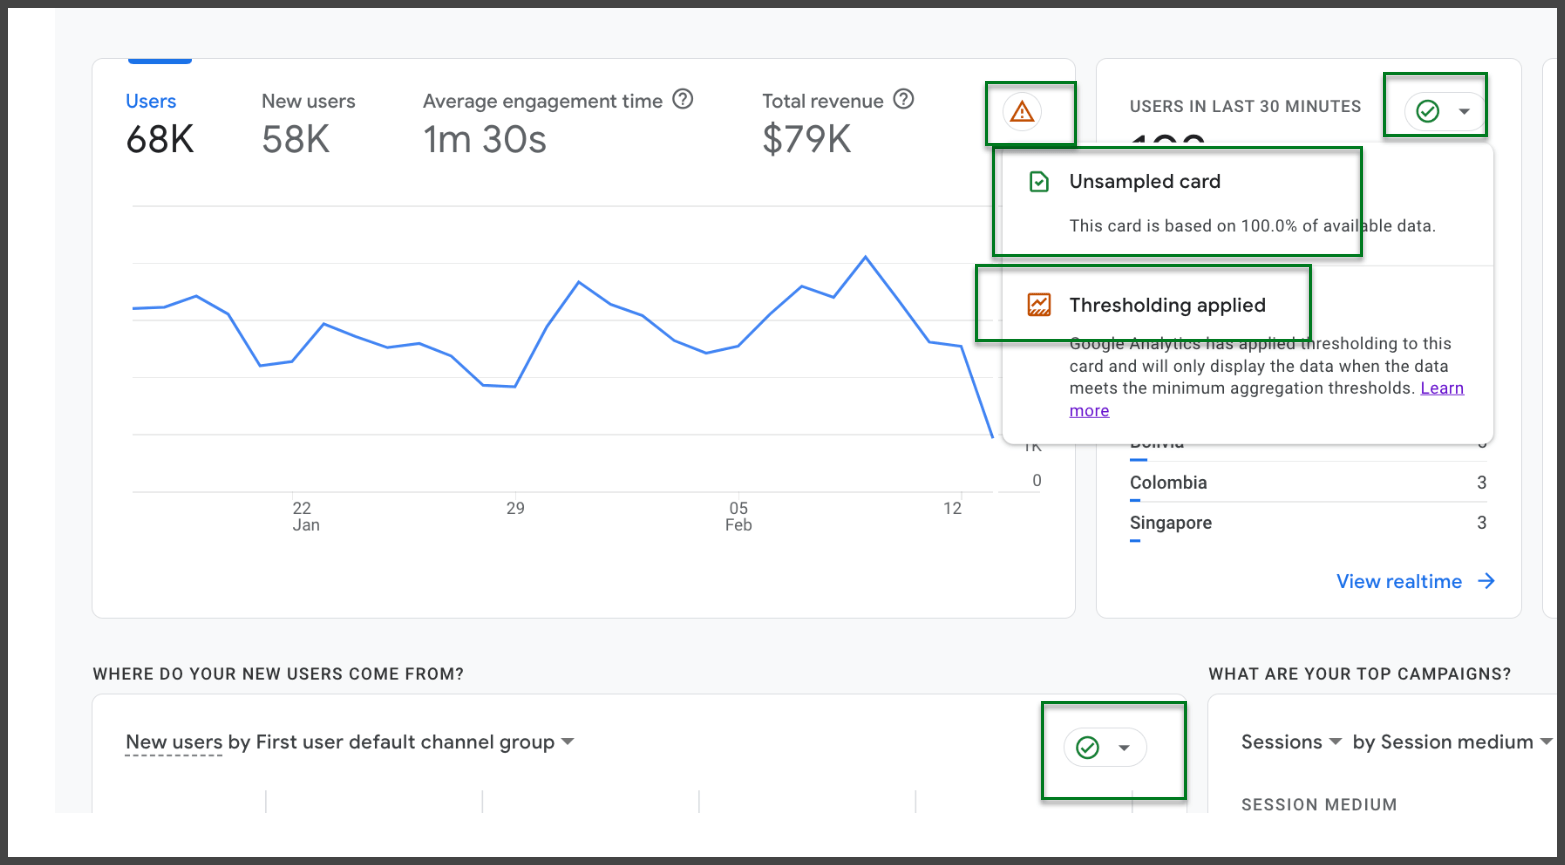
This will be a really valuable addition for marketers, in terms of explaining why some data might match / non-match that from client’s internal reporting systems (which are likely unsampled).
Matt also notes new one-click reporting creation in explore mode, as well as some updates to Google Analytics 360 properties.
Main takeaway: It will now be much easier to distinguish between sampled / unsampled data within GA4. This is a win for both marketers, and those receiving data from marketers.
Other Google Analytics 4 Updates
Posted February 15th on Search Engine Land
This news is largely related to the previous post we were looking at from Search Engine Journal. Nicole Farley of Search Engine Land, has some additional comments:
“A new “(other)” row message in the data quality icon. The “(other)” row appears when a report is affected by cardinality limits, which results in the less common data beyond the limits grouping into an “(other)” row. In this new message, you now have several ways to reduce or eliminate these cardinality limits.
All properties now have a one-click option to create the same report in Explore. The “(other)” row never appears in Explore because it uses raw, event-level data.”
Did that sound like another language to you? All you really need to know is that a new category of data quality now exists, and that is known as “(other)”. At a time when marketers are needing higher levels of precision, this may draw groans from some.
What are “cardinality limits”? From Appsflyer:
“The number of unique values in a dimension is called cardinality. Most analytics and aggregated reporting tools have cardinality limits per dimension. As a result, when the number of unique values in a dimension exceeds the cardinality limit, the remaining data is grouped in an exceeded group.”
Before you can understand this, you need to consider the difference between dimensions and metrics. Metrics are numerical values, mathematical quantities. For example, the number of users to access your site is a metric, because you can gain a sum or count. Dimensions are the subjective lines along which you wish to separate or divide your metrics. For example, “default channel grouping” is a good example. If you break your total users down by channel grouping, you would then get user counts per channel via which users accessed your site (direct users, search users, paid / social users, users via email campaigns etc).
Now that you understand the difference between dimensions and metrics, Appflyer’s definition of cardinality limits should make more sense. Imagine if the “default channel grouping” dimension had a cardinality limit of 3. If that were the case, you’d only see 3 different groups when dividing your total users by the channel grouping. You might see search, direct and email. If social came in 4th, then those users would be lumped into “(other)”. Note that the adoption of more aggressive cardinality limits within GA4, is hardly likely to be this extreme.
Main takeaway: As Google’s Analytics team continue their duel with the Data (Looker) Studio team, who have bombarded the analytics API for many years… it’s not surprising to see Google creating more data granularity limits to ease that burden, and others.
Optimizely & Google Partner on GA4 as GA3 Sunsets
Posted February 13th on Yahoo Finance
An interesting 3 minute read from Yahoo Finance. If we go back in time, Yahoo provided a well-known search engine. In fact, Yahoo (the search engine) does still exist, though it is seldom used today. In any case, we’re always interested to hear from Yahoo, and it’s often their finance section which has some interesting buried nuggets.
Here’s what Yahoo have to say:
“Optimizely, the leading digital experience platform (DXP) provider, today announces it has been selected by Google to collaborate on an integration with Optimizely Web Experimentation and Google Analytics 4 (GA4). This announcement follows Google’s decision to sunset Google Optimize, its former web analytics and testing tool.
Google’s selection of Optimizely marks the start of a new chapter for both companies and their customers. To access real-time statistics, generate personalized customer experiences, and integrate seamlessly with other tools in their tech stack, digital marketers typically sacrifice speed or user experience. Optimizely’s experimentation tool offers all of these capabilities without compromise.”
There’s that word again, “experience”. Nearer the beginning of this article, we impressed upon our readers, the struggles of the current economic climate. We stated that more personalised, tailored experiences were required, in order to keep ads (and their associated products) relevant. This news from Yahoo, tells the story again.
If you don’t know who Optimizely are, check out their site. They have strong ties with Google. In a previous post, we noted that Google were looking to sunset Google Optimize and move some of that functionality over to GA4. It seems as if, for those who want the real granularity and detail, Google are somewhat pushing certain Google Optimize users to migrate to “Optimizely Experimentation” (a product from Optimizely):

This isn’t the only way in which Google and Optimizely appear to be linking arms. From the language used in the post, it appears as if Google will be using Optimizely directly with GA4. Maybe Google will utilize Optimizely within GA4, to analyse logged in users for experiences and patterns of behaviour. Those insights could prove lucrative to the further development (and AI-integration) of the GA4 product.
Main takeaway: If you end up being unhappy with Google’s implementation of A/B testing within GA4 (as Google sunset Google Optimize) then you might look to move to Optimizely, who seem to be Google’s partner for this kind of stuff. In addition, Optimizely may be deployed by Google to further enhance the GA4 product, and the experience which users have with that product.
Matomo named Traffic Analysis Tool of the Year
Posted January 30th on Business Leader
Okay, so technically this post is from January. However, this post was released after our January Analytics news post was concluded. It came right at the end of the month (January 30th) and it’s just too interesting, not to comment on it.
Not only was Matomo (a product competing with Google Analytics 4) named “Traffic Analysis Tool of the Year” (W3Tech Web Technologies of the Year award) – but this announcement seemingly coincided with a Google Analytics market share drop.
Alice Cumming of Business Leader writes:
“Matomo, a privacy-friendly, ethical open-source web analytics platform, has been awarded the W3Tech award for Traffic Analysis Tool of the Year, previously won by Google Analytics and Facebook Pixel, amidst Google Analytics’ market share dropping.
The year’s W3Tech Web Technologies of the Year award data, analysed by technology experts at the Parliament Street think tank, uncovered that Google Analytics’ market share has dropped over the past 12 months despite a surge in December.”
I don’t think we could sensibly attribute all of this drop to the recent success of Matomo, but it is interesting. When we tested Matomo, we thought it was strong in many regards, but still lacked some basic reporting views and the sheer granularity of GA4’s data harvesting / reporting. As such we did not decide to move over.
Although that’s true, it’s hard to deny Matomo’s benefits and focus on privacy:
Matthias Gelbmann, Co-Founder and CEO of W3Techs, was quoted in Alice’s post:
“Privacy is a very important issue in our own operations, therefore I’m glad that we can observe a general trend towards privacy-focused platforms.
We see more and more providers having that aspect as a main focus as well as the established privacy-oriented players gaining popularity. This also puts pressure on all market participants to no longer ignore privacy as a key property of their products.”
Many organisations were willing to use Google Analytics for their web-data and reporting needs. The fact that Google was probably using a lot of their data, didn’t bother them so much. Why should it? Google Analytics was the best tool on the market for reaping and reporting on web data. And critically, it was free.
Whilst Google Analytics is still free, the GA4 roll-out process and adoption has been plagued with issues. In addition, a recent spat between the Data (Looker) Studio and Analytics teams (internally, at Google) has largely curtailed the ability to effectively (and accurately) report from within Google’s own product ecosystem. Whether it’s unspecified data sampling, or ‘quota limit’ problems, Google’s own internal battle is affecting its users, and sadly, the popularity of its product.
There are whole videos which have been produced, and products which have sprung up to address Google’s internal ineptitude:
https://www.youtube.com/watch?v=t_OYFcN9Ebo
The above video is from Analytics Canvas, a new product to help make your queries (between Data / Looker Studio, and GA4) more efficient, to avoid quota limits.
Analytics Canvas is one product which we’re exploring. When we’re seeing YouTube comments like this:

… we know that we’re not the only ones to have realised how badly Google have damaged their own product ecosystem. Will Google recover from this? Only if they manage to solve their own internal disputes between their different internal teams. Every month that these problems continue, more products will spring up to supplement or replace parts of the Google product ecosystem. And with Microsoft’s Bing having the current AI edge (ChatGPT integration), this could be a very dangerous time for Google. Make no mistake, Goliath is under attack.
Main takeaway: Google are losing ground in the race to retain mastery of web-analytics products and platforms. In addition, their search engine is under renewed threat from an AI-empowered Microsoft Bing. Will Google get it together? Time will tell.
Here at Anicca, we stay up-to-date on all Google Analytics, web-analytics and data developments and apply them to our clients’ campaigns. You can check out our Analytics services here. Impressed with our knowledge and coverage of analytics? Give us a call on 0116 254 7224 (or fill out our contact form).