Reporting that turns data into decisions, not noise.
Custom dashboards and analysis that show what your marketing is really doing, which channels drive revenue and what to do next. Built in Looker Studio by specialists who know their metrics from their dimensions.
Reporting that answers the questions the board actually asks.
Data is the foundation of good decisions, but raw analytics rarely answers the real question: what is working, what is not, and where the next pound should go. We turn the numbers into custom reports built around your goals, not a generic template.
Live dashboards, conversion and funnel analysis, attribution and ongoing monitoring all sit on one thing: accurate tracking. We get the data collection right first, then build reporting you can actually trust and act on.
What our reporting covers
Five shifts in data and reporting that have changed how you should run it.
Privacy changes rewrote the plumbing, dashboards replaced static decks, and attribution got both harder and more important. Reporting that ignores all three misleads with confidence.
Reporting is only as good as the tracking
GA4, consent mode and server-side tracking changed the plumbing. Get the data collection right or every dashboard above it is wrong.
Dashboards beat static decks
Live dashboards replace reports that take days to compile. The time saved goes into acting on the data, not assembling it.
Attribution is harder, and more important
With privacy changes and longer journeys, last-click flatters some channels and hides others. Proper attribution is now essential to spend well.
One view across every channel
SEO, paid, social and email reported in isolation hide the full picture. A unified view is what lets you move budget with confidence.
Insight beats metrics
A wall of numbers is not a report. The value is in the interpretation: what changed, why, and what to do about it.
Our data and reporting services, end to end.
From the custom reports and Looker Studio dashboards to funnel analysis, attribution modelling and the ongoing monitoring that keeps it all accurate.
Custom reports
Reports designed around your specific goals, whether you are tracking website performance, campaign ROI or customer behaviour, with clear insights you can act on.
KPIs · ROI · BehaviourVisualisation & dashboards
Custom Looker Studio dashboards that turn complex data into real-time, shareable views of your KPIs, from overview to drill-down.
Looker Studio · Live · KPIsConversion & funnel analysis
Detailed analysis of how users move through your site and where they drop off, so you know which pages and steps to optimise.
Journey · Drop-off · CROMulti-channel reporting
One report across SEO, paid media, social and email, showing how each channel contributes so you can allocate budget effectively.
SEO · Paid · EmailAttribution & ROI analysis
Custom attribution models that reveal which channels and tactics drive conversions, so you understand and improve your return on investment.
Models · ROI · SpendMonitoring & optimisation
Continuous monitoring that keeps reporting accurate and surfaces trends, opportunities and recommendations as your business evolves.
Trends · Alerts · ActionsNot sure your numbers can be trusted?
We will audit your tracking and reporting setup: whether your tags and events are firing correctly, where data is being lost, and how clearly your dashboards answer the questions that matter. You get a single-page scorecard with the three things to fix first.
- Tracking and tag-health review
- Data accuracy and gap analysis
- Dashboard and KPI clarity check
- Free. No sales call required to receive it.
Sharper decisions, for brands you might know.
Worked examples. More case studies in the full library, filterable by service and sector.
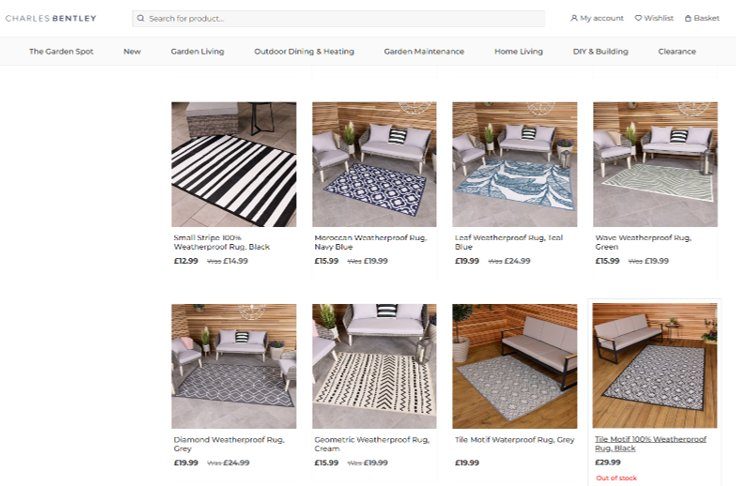
PPC, SEO, Paid Social and Shopping across a 30,000-SKU catalogue.
14-year client partnership. Full-funnel PPC, SEO, Paid Social and Shopping programme across a 30,000-SKU catalogue on Magento + Hyvä.
Read the full case study →
Ireland’s largest independent furniture retailer.
Ireland’s largest independent furniture retailer. Full digital programme with GA4 server-side tracking, Shopping and Paid Social.
Read the full case study →
UK’s leading tree surgery equipment retailer.
UK’s leading tree surgery equipment retailer. Full-funnel Google Ads, SEO and Shopping programme across a 5,000+ SKU catalogue.
Read the full case study →Four reasons brands pick us for data and reporting.
More than metrics.
We go beyond basic numbers to deliver insight that drives decisions, with a full evaluation of your data ecosystem so every report contributes to growth.
Tracking audited first.
We start with a thorough audit of your tracking and reporting setup, because dashboards built on broken data just mislead with confidence.
One view across channels.
SEO, paid search, paid social and content analytics in a single, unified view, so insight is aligned across teams and channels.
Senior specialists, 19 years in.
Analysts who know their metrics from their dimensions and have built dashboards for brands for years. Independent Leicester agency since 2007.
What brands ask before they start.
What is the difference between reporting and analytics?
Reporting presents data through dashboards and charts to show your KPIs. Analytics is the wider field of collecting and interpreting that data to uncover patterns and trends. Reporting gives a snapshot; analytics is the foundation that makes good reporting possible.
What is Looker Studio?
Looker Studio is Google’s free data visualisation tool. It connects to sources like GA4, Google Ads, Search Console and Sheets, and turns raw data into interactive, shareable dashboards. It is the tool we most often use to build client reports.
Can analytics replace traditional reporting?
Analytics transforms reporting from static decks into live, dynamic views. Instead of waiting days for a report to be compiled, you see trends as they happen, which means decisions are based on current data rather than history.
What are the main types of analytical report?
Descriptive (what happened), diagnostic (why it happened) and predictive (what is likely next). A proper analytics setup covers descriptive and diagnostic reporting; predictive is possible too, though it needs more data and effort.
How does Anicca handle reporting?
We collect and structure data from sources like Google Analytics, focus on the KPIs that match your objectives, and present them in clear Looker Studio dashboards, then interpret the data so you get insight, not just numbers.
How do I get started with better reporting?
Usually with an audit of your current tracking and dashboards. From there we fix the data collection, build the reports you actually need, and set up monitoring so they stay accurate.
Ready to trust your numbers again? Let us run the audit.
30 minutes with the analytics team. No slide decks, no hard sell. You leave with an audit of your tracking and reporting and three things to fix, whether you hire us or not.
How can
we help you?
Tell us what you are working on. A senior member of the team will get back to you within one business day, no account managers in between.