Audits to Understand Changes in Web Traffic, Leads & Sales + Impact of Covid & Cost-of-Living Crisis
Insight Audits are a series of discovery projects that allow you to understand what is happening on your website, in your sector (your competitors) and within the economy*. These audits require the use of your own first-party data, such as Analytics but they often require the use of third-party tools, some of which you may need to pay for. You can also get an agency, such as Anicca, to carry out the Insight Audit on your behalf (see below).
In this article, we are going to cover:
- What causes changes to your traffic, leads and sales
- Economic factors that have impacted the demand for products and services over the last 2 years
- How to determine changes in your sector and competitors?
- What factors impact your site performance?
- How to use Insight Audits to determine the cause of fluctuations in your site?
- Reviewing economic factors that are impacting the UK now
- Auditing sector and competitor performance
- Channel-specific audits to compare the performance of your site and marketing vs your competitors
- A real case study of an Insight Audit to illustrate the diagnostic process for auditing the performance and marketing of an ecommerce site vs their competitors
- How Anicca can help you carry out an Insight Audit
*Note: Anicca also carries out additional audits to understand your audience and what they are saying about you (using social listening tools), but these are not covered in this article.
You can watch Ann Stanley present this data and demo the auditing techniques in our Friday webinar below.
1. What causes changes to your traffic, leads and sales
1.1 How predictable was your traffic, leads and sales before Covid?
Before Covid you would have expected reasonably predictable changes in web traffic, leads or sales:
- Growing businesses that are investing heavily in marketing, would be able to see month-on-month or year-on-year growth. Their market share would increase relative to competitors’ or they would continue to take a similar share in a growing market
- Companies that were not investing significantly in marketing may have seen a relative decline in market share but may need to use other channels to support a poorly performing website
- Seasonal businesses could predict when they expected visitors to return. They would use year on year comparisons and look for variations, such as those caused by an early easter or different weather patterns
- These predictable or modest changes would be monitored weekly or monthly by reporting traffic, leads and sales from the back-end of their website or by using Analytics. The use of a Data Studio dashboard or an ecommerce website phone app, could also help to monitor leads or sales.
Examples of Analytics data for different websites with growing traffic (prior to Covid)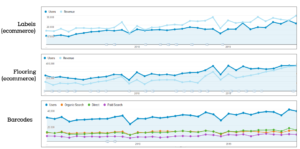
1.2 Causes of less-predictable or big changes in web traffic leads or sales before Covid
Before Covid, any big changes in traffic leads and sales tended to be triggered by:
- Annual events like Valentine’s Day or Black Friday
- Algorithm changes in the search engine, resulting in shifts in rankings and corresponding drops or increases in organic traffic
- Changes in off-line marketing by you or a competitor, such as the launch of a TV campaign, could result in increased organic search for a brand or direct traffic to your site
- Other external factors (both positive and negative), such as publicity over a new product, another brand or a change in demand
- Rarer geopolitical events like Brexit, the banking crisis and recessions, where the impact may have happened quite quickly or over several months
Analytics data showing big fluctuations in traffic caused by external & internal events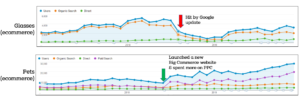
1.3 Why web traffic, leads & sales have been so volatile over the last 2 years
a) How Covid and lockdowns have impacted our behaviour
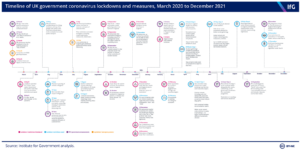
- The initial impact of Covid and lockdowns caused huge impacts on demand, depending on the sector, product or service. You can see the lockdown timeline in the diagram below and in detail at https://www.instituteforgovernment.org.uk/charts/uk-government-coronavirus-lockdowns
- Longer-term changes in behaviour, digital transformation of businesses, new users of ecommerce and more competitors
- Significant reversals of demand for ecommerce when retail opened following lockdowns
- Big changes in demand for specific products like home, garden, fitness equipment etc. Where the initial increase in demand for these products was driven by working from home, no travel, and in some cases more disposable income.
b) Drops in demand in 2022, as consumers switch to in-person retail and/or buying essential purchases
- In 2022, we have seen unprecedented increases in inflation and a cost-of-living crisis, which has significantly impacted consumer (and business) confidence
- Retailers and ecommerce have seen a drop in demand, as more consumers shop in person rather than online (after the winter lockdown), or where consumers have responded to the cost-of-living crisis by reprioritising their spending (especially when they can only afford essential items).
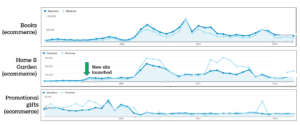
Examples of Analytics data for ecommerce websites with huge fluctuations in traffic and sales over the last 2 years
c) Business confidence
- We have noticed that some of our B2B clients’ have witnessed drops in traffic, leads and calls. After checking their competitors’ data (using our Similarweb tool), we found that this was not unique to them but indicative that in some sectors demand has been lower in Q1
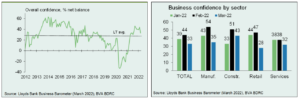
- This appears to coincide with a reduction in business confidence, which dropped significantly in March (down 11 points to 33%), but remained above the long-term average (28%), (according to the latest Lloyds Bank Business Barometer).
These topics are discussed in more detail in Section 2, below.
1.4 Factors impacting supply and demand
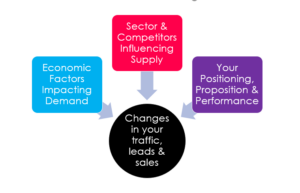
The following model shows the relationship between the different factors that will influence supply and demand, and therefore the performance of your website.
2 Economic factors that have impacted the demand for products and services over the last 2 years
2.1 The shock of Covid and how it impacted buyer behaviour
The rapid and global impact of Covid required governments and individuals to change their behaviour within days. After the initial shock, there were sudden and catastrophic drops in demand for some products and services, whereas others were in huge demand (see below). The long-term impact meant that with shops being closed, ecommerce exploded and around 7 years of digital transformation happened in as many months:
- Different products (and services) could suddenly be bought online
- Many more users had to become tech-savvy
- Working from home and furlough payments meant that some people had more disposable income and bought large purchases instead of spending their income on transport costs, entertainment/hospitality or foreign holidays
- New competitors entered the market to take advantage of demand, either diversifying away from struggling sectors or setting up for the first time
2.2 The end of lockdowns
At the end of the first lockdown in July 2020, there was still a lot of naivety about the long-term nature of the virus and that it was going to return (with vengeance) in the winter, i.e. before the vaccination programme could get started. However, the government lifted a lot of restrictions across most of the country and introduced the “eat-out-to-help-out” scheme. Non-essential shops were allowed to trade (for a few months) allowing a mini-restart of the economy.
The ecommerce boom had just started, and there was still a lot of nervousness in some communities to venture out to the shops. Although consumers had a choice to shop in person, this turned out to be an important time for the growth of many b2c and b2b sectors online.
There were also varying restrictions across the country (local tiers), with areas like Leicester, stuck in some form of restrictions for most of the first year. The stop-start-restart of the economy was a disaster, particularly for the hospitality sector and especially leading up to Christmas 2020. Despite promises to the contrary, a lockdown was imposed at the last minute, but not early enough to avoid seeding another peak in infections, which hit everyone a few weeks later in January 2021.
The ending of the two winter lockdowns (in March 2021 and 2022), had much more significant impacts on ecommerce sales, as shoppers returned to the high street. However in March 2022, we saw the biggest impact on ecommerce; as this coincided with tectonic shifts in the economy, the start of the cost of living crisis and the frightening geopolitical events. February 24th 2022 was the date that the UK government ended all lockdown restrictions in the UK. This was much earlier than most of the world and coincided with Russia invading Ukraine!
2.3 Changes in buying behaviour and the buying cycle
After such a boom in online sales in 2020 and 2021, many online retailers assumed ongoing growth in 2022. They may have increased stock levels to meet the expected demand and to overcome many of the supply chain issues that have continued to be a problem since the end of 2019.
However, by March it became apparent that consumer behaviour was changing. They were either limiting spending or shifting to buying different products or services. In many cases, they had already invested heavily in certain types of goods, such as home and garden, home fitness, etc. and they did not need to purchase other large items for the foreseeable future. Instead, they would rather spend on the things they have missed – such as international travel.
2.4 Brexit and supply chain issues
Supply chain issues started to hit at the end of 2019, with stock-piling prior to Brexit. There have been other UK-specific issues, since the Brexit transition period ended on 31st December 2020. This resulted in further red tape and delays and created significant barriers and resulting drops in UK-EU trade.
The global breakdown of international supply chains was initially triggered when China and Asia went into their first lockdown (at the end of January 2020). This highlighted our dependency on Asia, where 28% of global goods are manufactured and exported from China.
By Christmas 2020, there were blockages in the ports, stock-piling to preempt the end of the Brexit-transition period and the new associated import rules and delays.
This had several other impacts,
- Shortages and/or increases in prices of certain goods
- Containers were in the wrong place and in short supply, pushing the global cost of a shipping container from below $2k to over $10k, and this was even higher in the UK.
- Many UK and EU exporters reduced or stopped exporting in or out of the UK, due to new red tape, with some sectors badly affected
- Many UK (and EU) businesses are trying to become less reliant on importing goods, meaning that they are trying to source products locally. This has coincided with an increase in public and business awareness of net-zero and climate impact of importing goods over long distances. This has resulted in an increase in UK manufacturing, which by December 2021 was back to pre-pandemic levels.
Note. In April 2022, further custom checks have been delayed for the fourth time, to avoid even more trade barriers and there are still unresolved issues with the Northern Ireland Protocol.
2.5 Cost of living crisis
According to the bank of England, inflation could rise to 10% later this year in the UK. This has meant that there has been the biggest squeeze in house old income in 70 years and an inevitable drop in sales across many sectors, as consumers tighten their belts.
Various factors have contributed to this:
- Supply chain issues (caused by a combination of Covid and Brexit), resulting in shortages and increased prices (see above)
- Wage inflation and staff shortages caused by Brexit and demand for more workers in specific sectors
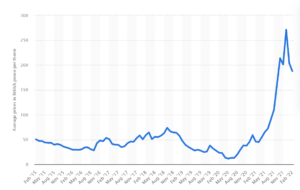
- Global energy and fuel prices increased rapidly in the last quarter of 2021 and the first quarter of 2022, which was caused by increased demand for gas and electricity (due to weather conditions and more global manufacturing) at a time when renewables dropped (wind/solar).
- This has also increased the costs of diesel and petrol, for example, the cost per litre for unleaded petrol increased by 20p to £1.70
- The increase in heating and electricity prices hit UK consumers particularly hard because we utilise a 6-month energy cap which sets energy prices. In April this resulted in an increase of over 50%, with more increases likely in October.
- The war in Ukraine resulted in further increases in energy and food prices, as western economies try to wean themselves away from Russian gas and oil
- Political decisions such as cancelling the £20 Universal credit top-up, increasing NI contributions, banning the use of cheaper “red diesel” and many others, have also contributed to inflation and the cost of living crisis.
3. How to determine changes in your sector and competitors?
3.1 Is demand changing for your sector?
How the popularity of topics in search engines can indicate changes in demand
Potential customers will generally revert to search engines to look for new brands and suppliers. As a result, searches for terms relating to specific product categories or sectors can be a useful indication of the demand for that product or sector.
Google and other search engines such as Bing, provide various tools that can be used to determine the popularity and search volumes of individual search terms or keyphrases. This data is mainly used by marketers running Google ads campaigns or by SEO’s who will use the data to try and optimise their website to achieve a higher ranking in the search engine results pages (SERPs).
Tools to determine search volume of topics and key phrases
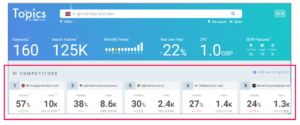
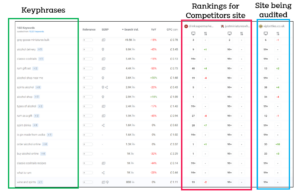
In addition to accessing the Google keyword planner tool from within your Google ads account (which needs to be in Expert mode); there are various other free tools that use the same data within their software or browser plugins. Our favourites include https://keywordseverywhere.com/ (which is a browser plug-in) and https://topics.seomonitor. Anicca uses this tool in our audits because it also shows the competitors and their rankings for the key phrases in your selected topic. In fact we also have a paid SEOmonitor account and that has a lot of other features that are not available in the free version.
Search volume for brand phrases to determine the popularity of you or your competitors
Once a brand becomes well-known within a target audience, then existing or potential customers will either go directly to their website (direct traffic) or search for the brand on Google or other search engines. The same third-party tools listed above can also be used to see changes in brand searches for you and your competitors.
However, you also have your own first-party data, so additional information can be accessed via Analytics or Search Console, which shows the source of traffic. In the case of Search Console, you can see data for individual keyphrases or Queries. This includes:
- How often your listing was shown (impressions)
- The average position or rank you achieved
- The proportion of searchers that clicked on your listing (click-through rate or CTR)
- The number of clicks you received.
Search Console only stores 16 months of data, but you can use filters to split the brand and non-brand queries.
3.2 Are you or your competitors investing more in marketing & changing your market share?
Although marketing activity can also be focused on building brand awareness, most businesses will generate a large proportion of the enquiries/leads or sales directly or indirectly from their website. As a result, a lot of marketing activity (and budgets) are spent on new customer acquisition and trying to drive traffic to the website.
It is possible to use third-party tools to compare website traffic to try to determine how active and possibly how big your competitors are. Tools include SEMrush and Similarweb provide free and paid services. We have a paid account of Similarweb, which gives us a lot of extra data, which we use in our insight audits
3.3 Are there any new entrants and competitors?
We use different tools to track traffic data over time, to see if any new competitors are entering or leaving a sector. Looking at “industry leaders” data in Similarweb can help with this, although the data will vary by marketing channel. New entrants tend to have to rely on paid channels to get traffic, due to the time it takes for SEO to work and get organic search results. As a result data within your google ads account can be really useful to understand who is bidding for the same phrases as you within your sector. This data is contained within the Auction insights report.
4. What factors impact your site performance?
4.1 Have you invested more or less time and money into your marketing as compared with your competitors
Increases in marketing activity can result in more traffic and sales but this has to be relative to your competitors. We use Simlarweb data to understand trends over time for each channel. More granular data around direct traffic and brand searches can also indicate if other offline marketing is supporting their digital marketing.
4.2 Have you been impacted by any external shocks like a Google algorithm
This data can only really be seen within your internal Analytics as you need to be able to see if the date of any changes coincides with any Google algorithm updates or is indicative of other changes like seasonality or migrating to a new site.
4.3 How does your site perform as compared to industry benchmarks
When you have your own website is often difficult to benchmark your performance against other sites or sectors. Comparing traffic volumes is relatively easy (using the tools above) if your site has more than 5k visits per month. However, below this, the sensitivity of the tool can cause inaccuracies, for example, if you have a new or a niche site.
Benchmarking your conversion rates, either for leads or transactions requires research into specific sectors. much of the published data includes data from big brand websites, where conversion rates can often exceed 5%, whereas smaller or new sites may only have a conversion rate of 1%. Tracking phone calls or more niche sites can often result in a conversion rate of around 3%. Conversion rates will also vary considerably by channel, location, device, and for new vs returning visitors.
You can use your own Analytics to understand how each of these factors impacts conversion rate and how it changes over time. Most small businesses use Google Analytics, however, this will be retired next year and replaced with GA4. You can install this now and run it in parallel, however, the conversion rate is not currently a standard metric in GA4, and so we get around this by creating our own dashboards in Data Studio, a free reporting tool also from Google.
4.4 Have you made any major changes like a new design or addition of a policy pop-up
Big changes in traffic or conversion can often be a direct result of something that you or your developer has done to a site. here are some common examples:
- The developer accidentally removes the tracking code so all tracking is lost overnight,
- You get a drop in conversion rate due to changes to forms or errors.
- Adding a privacy policy notice which discourages users to accept – can result in losing 90% of your data.
- Site migrations can actually impact organic traffic especially if redirects are done incorrectly
5. How to determine the cause of fluctuations in your site?
Have you witnessed large fluctuations in web traffic leads or sales?
How can you tell if the cause is the economy, your sector or your site?
5.1 Insight Auditing techniques
- How to determine the economic factors impacting demand
- News and announcements from big brands and the platforms
- Google trends and other search volume data
- How to audit data from your sector and competitors that influence supply
- Supply and demand for you vs competitors
- Competitor marketing activity relatively to yours
- New entrants and exits – using PPC auction insight data
- Auditing your site performance
- Web traffic and channel data
- Web conversion rates and site issues
- Channel specific audits – like SEO, PPC etc.
6. Reviewing economic factors that are impacting the UK now
6.1 Reviewing the news – turndown for ecommerce

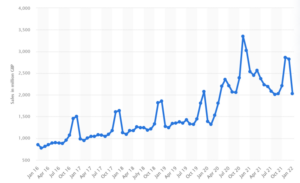
6.2 Value of internet retail sales monthly in the UK from January 2016 to January 2022
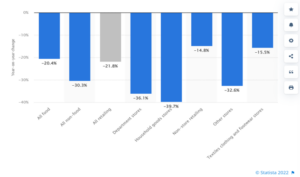
6.3 Percentage change in internet retail sales value in the UK in March 2022 vs 2021, for different sectors
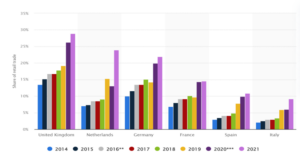
6.4 Retail ecommerce sales as a share of retail trade in selected European countries (2014 to 2021)
In the graph below, you can see data for the leading countries in Europe and how Covid caused a significant increase in e-commerce sales as a share of retail. This also shows that even before Covid, the UK leads in ecommerce, with an average of 19% share of retail in 2019 vs 14-15% in the Netherlands and Germany. The share of ecommerce grew by at least 25% in all these countries.
According to the ONS, the proportion of UK sales taking place online peaked at 37.1% in February 2021, in the final UK Covid-19 lockdown, but has since fallen steadily, reaching 26% in March 2022. However, this is still significantly higher than in the pre-covid years.
https://internetretailing.net/industry/industry/just-over-a-quarter-of-retail-sales-online-in-march-2022-as-steady-decline-continues-ons-24716
6.5 Variable performance of the ad platforms

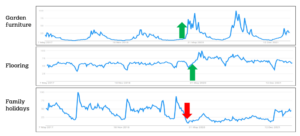
6.6 Google Trends data for 3 sectors
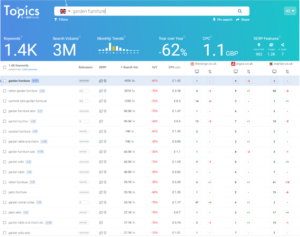
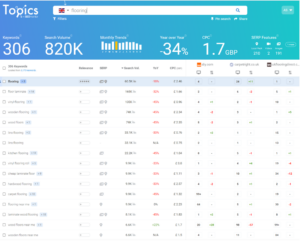
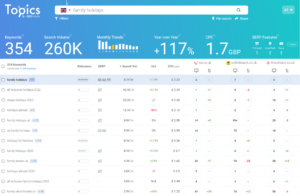
6.7 Use of search volume data and rankings (using topics.seomonitor.com)
Garden furniture terms had a -62% drop in searches
Flooring terms had a -34% drop in searches
Family holidays terms had a +117% increase in searches
7. Auditing sector and competitor performance
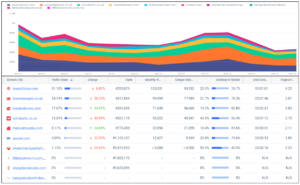
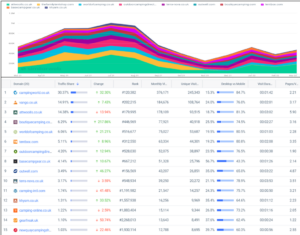
7.1 Use of Similarweb data to understand traffic to top sites within a sector
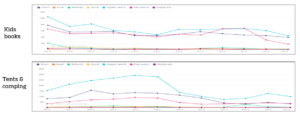
The graphs below show the traffic to the top 10 sites within each sector, since March 2021. The tables show the share of the traffic and other metrics for April 2022.
Kids books
Tents and camping
7.2 Use of Similarweb data to determine the source of traffic for a sector over time
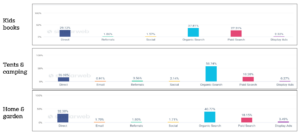
7.3 Use of Similarweb data to compare the source of traffic by sector (data for April 2022)
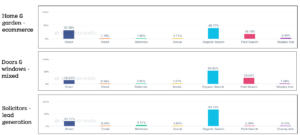
7.4 Use of Similarweb data to compare the source of traffic for 3 ecommerce sectors (data for April 2022)
8. Channel-specific audits to compare the performance of your site and/or marketing vs your competitors
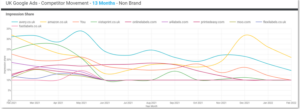
8.1 PPC Auction Insights tool to visualise your vs competitors’ share of paid search
You can use Auction Insights in Google ads and Data Studio to plot and visualise changes in impression share data over time. You can also use this to determine competitor behaviour, for example, new entrants or when they increase bids or budgets.
8.2 Keyphrase & rankings data using topics.seomonitor.com
8.3 Competitors’ Domain Authority & links using ahrefs.com

9. A real case study of an Insight Audit to illustrate the diagnostic process for auditing the performance and marketing of an ecommerce site vs their competitors
This case study is for an ecommerce site with lower traffic growth than the previous year (but increased revenue).
The purpose of the audit was to determine why the revenue growth was much lower than the previous year and what could be done about it?
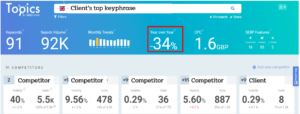
9.1 Are people searching as much this year? (Mar 22 vs Mar 21)
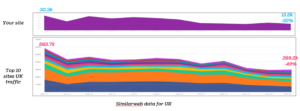
9.2 How did you do compared with your competitors last year? (Mar 21 – Feb 22)
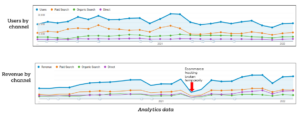
9.3 Where did your users come from and which channel(s) drove the most revenue? (Jan 2020 to Feb 22)
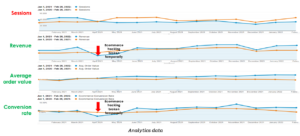
9.4 Did the visits and sales change compared with the previous year (Jan 2020 to Feb 2022 vs previous year)
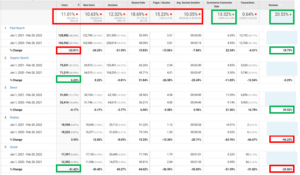
9.5 Which channels drove visits and revenue as compared to last year (Jan 2021 to Feb 2022 vs previous year)
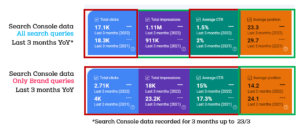
9.6 Impressions and clicks from the organic search results for brand (15%) or non-brand phrases (85%) (last 3 months vs previous year*)
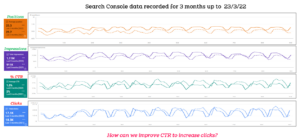
9.7 Search Console graphs (for all queries) (last 3 months vs last year)
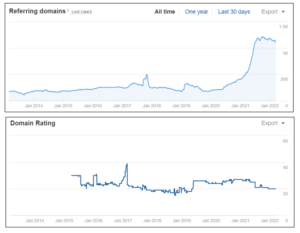
9.8 Has your PR activity resulted in more links to your site and higher domain authority?
9.9 Findings and recommendations from our Insight Audit
- There is an overall drop in search volume for target keyphrases across the whole sector, which has resulted in a significant fall in traffic to competitors’ sites (which is out of your control)
- This site also had a drop in traffic but had increased revenue due to a higher conversion rate and larger average order value
- Organic search traffic had a drop in click-through rate or CTR. This could be due to Google’s changes in the way they display their results, which have resulted in fewer clicks to external websites. We recommend investing time to improve the titles and descriptions to try and increase the CTR
- A drop in domain authority (DA) score, despite an increase in referring domains
10. How can Anicca help you carry out an Insight Audit
With more news about the cost-of-living crisis and drop in consumer and business confidence, we have written this detailed guide to help you to carry out your own audits of your site and the competitive environment for your sector.
However, some of the techniques we use require the use of paid software, so we also offer a mix of free and paid insights reports on industry trends to show you how you are performing against your competitors. Anicca is now offering a limited number of free competitor and Analytics reports. Demand for these reports is expected to be high, so priority will be given to sites where sufficient data is available.
To claim your FREE Insight Report you will need to have a minimum of 10k visits to your site per month, and you will need to provide us access to your Google Analytics and the names of your top 10 competitors.


